Spatio-Temporal Clustering
[1]:
import movekit as mkit
import numpy as np
import pandas as pd
import matplotlib.pyplot as plt
from matplotlib import animation
[2]:
# Enter path to CSV file
path = "./datasets/fish-6.csv"

data = mkit.read_data(path)
data.head()
[2]:
| time | animal_id | x | y | |
|---|---|---|---|---|
| 0 | 0 | 0 | 201.623002 | 186.148565 |
| 1 | 0 | 1 | 247.658670 | 177.650135 |
| 2 | 0 | 2 | 127.457230 | 20.572136 |
| 3 | 0 | 3 | 231.180722 | 172.861323 |
| 4 | 0 | 4 | 217.739517 | 189.203565 |
Movekit allows the use of many different clustering algorithms for spatio-temporal clustering: dbscan, hdbscan, agglomerative, kmeans, optics, spectral, affinitypropagation, birch.
[3]:
#normalize the data first
data_norm = mkit.normalize(data)

#then cluster it
labels = mkit.clustering('dbscan', data_norm, eps1=0.05, eps2=10, min_samples=2)

#OR cluster with the splitting-and-merging method (data is partitioned into frames and merged afterwards).
#labels = mkit.clustering_with_splits('dbscan', data, frame_size=20, eps1=0.05, eps2=10, min_samples=3)
[4]:
labels
[4]:
array([0, 0, 1, ..., 3, 0, 0])
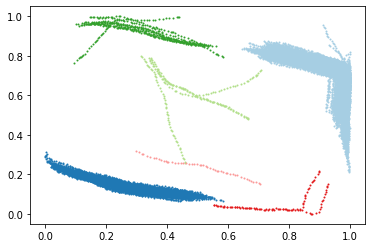
[5]:
def plot(data, labels):
    colors = ['#a6cee3','#1f78b4','#b2df8a','#33a02c','#fb9a99','#e31a1c','#fdbf6f','#ff7f00','#cab2d6','#6a3d9a']

    for i in range(-1, len(set(labels))):
        if i == -1:
            col = [0, 0, 0, 1]
        else:
            col = colors[i % len(colors)]

        clust = data[np.where(labels==i)]
        plt.scatter(clust[:,0], clust[:,1], c=[col], s=1)
    plt.show()

    return None

data_np = data_norm.loc[:, ['time','x','y']].values
plot(data_np[:,1:], labels)
[ ]: